Page 5 of 30 FirstFirst 12345678915 ... LastLast
Results 81 to 100 of 590

Thread: Financial Crisis - 2013 - ????

  1. #81
    Super Moderator Malsua's Avatar
    Join Date
    Jul 2005
    Posts
    8,020
    Thanks
    2
    Thanked 19 Times in 18 Posts

    Default Re: Financial Crisis - 2013 - ????

    Watch Copper.

    It's about to get dumped. This means the Chinese are about to take it in the shorts as they use copper for all sorts of collateralization.

    I don't think this will have much impact on the US, in fact, I suspect our markets will continue to run or stay flat even as the Fed begins to hint at the end to QE.
    "Far better it is to dare mighty things, to win glorious triumphs even though checkered by failure, than to rank with those poor spirits who neither enjoy nor suffer much because they live in the gray twilight that knows neither victory nor defeat."
    -- Theodore Roosevelt


  2. #82
    Creepy Ass Cracka & Site Owner Ryan Ruck's Avatar
    Join Date
    Jul 2005
    Location
    Cincinnati, OH
    Posts
    25,061
    Thanks
    52
    Thanked 78 Times in 76 Posts

    Default Re: Financial Crisis - 2013 - ????

    Yep, I've been seeing that very news Mal.

    With markets staying flat, I'm pretty surprised at their performance today after the drubbing Japan's market took last night. Maybe tomorrow will be different considering it will be Friday before a 3 day holiday weekend.

  3. #83
    Postman vector7's Avatar
    Join Date
    Feb 2007
    Location
    Where it's quiet, peaceful and everyone owns guns
    Posts
    21,663
    Thanks
    30
    Thanked 73 Times in 68 Posts

    Default Re: Financial Crisis - 2013 - ????

    Perfect Storm Sparks Massive Nikkei Sell-Off

    Text Size
    Published: Thursday, 23 May 2013 | 2:40 AM ET
    By: Ansuya Harjani Assistant Producer, CNBC Asia


    Yoshikazu Tsuno | AFP | Getty Images

    A perfect storm of yen strength, a spike in Japanese government bond yields and new evidence of weakness in China's economy were behind a major sell-off Thursday in Japan's equity markets, said experts.

    The benchmark Nikkei 225 closed down 7.3 percent in a session that saw it rise 2 percent in early trade only to reverse direction and fall sharply. The broader Topix finished 6.8 percent lower.

    "Almost everything went wrong during the day - the bond market had a bit of a crash, China PMI data, and the yen is stronger. The market is really overheated, all it's looking for is a trigger," Nicholas Smith, Japan strategist at CLSA told CNBC.

    Following the sell-off in U.S. Treasurys overnight, Japan government bond (JGB) prices dived, forcing the yield on the 10-year JGB to 1 percent earlier in the day - the highest level in a year - spooking investors.

    (Read More: Japan Bond Yields Spike Again- 10-Year Now at 1%)

    Yields of JGBs, which have been extremely volatile in recent weeks, have risen substantially from a record low of 0.315 percent hit on April 5, a day after the Bank of Japan announced bold easing measures.

    Downside in the market was also driven by the fall in dollar/yen - which slid below the 103 level to as low as 101.8 in the Asian trading session as foreign investors locked in profits on their long positions in the currency pair.

    The yen holds an inverse correlation with the Nikkei as strength in the currency is seen as negative for the market that has a heavy concentration of exporters.

    "It seems like the move lower in dollar-yen has encouraged some profit taking on the Nikkei. Any signs of strain will lead to fear that the correction is beginning, leading investors to lock in gains," said Stan Shamu, market strategist at trading firm IG Markets.

    Disappointing economic data out of the world's second largest economy, China, was also a driver behind the sell-off, said strategists.

    (Read More: Outlook for China's Economy Just Keeps Getting Worse)

    The flash HSBC Purchasing Manager's Index (PMI) for May that was released on Thursday slipped to 49.6, falling under the key 50 level, which divides expansion from contraction, for the first since October.

    The unexpected contraction in factory activity in May has heightened the risk of a further slowdown in the second quarter, said economists.


    'Fast Money' Exiting


    Nikkei Needed Some 'Digestion': Pro

    Liz Ann Sonders, chief investment strategist and senior vice president at Charles Schwab, discusses the "remarkable" drop in the Nikkei and says it was caused by "short-term momentum money".

    Liz Ann Sonders, chief investment strategist at investment services firm Charles Schwab, noted the rapid decline in Japanese stocks could be also result of "fast money" exiting the market.

    "You've had a tremendous amount of really fast money go into that trade – short the yen long the Nikkei – momentum chasing money," Sonders said.

    "We may just be seeing a drain of that fast money," she added.

    Foreign investors have played a central role in driving gains in Japanese equities this year, pumping over $60 billion into the market as of the end of April.

    Remarks by Federal Reserve Chairman Ben Bernanke to U.S. Congress that raised concerns there could be a pullback in the central bank's bond buying program led to an overall decline in Asian equities.

    How Big a Correction?

    According to independent technical strategist Daryl Guppy, the sharp move lower in the Nikkei is a retreat from the historical resistance at around 14,580.

    The move was not unexpected, he said, noting that the market will see support near 13,360.

    "Look for consolidation patterns. A fall to 13,400 remains consistent with the long term up trend line," he said.

    Smith of CLSA says the market will likely stabilize soon as long as the Bank of Japan (BOJ) is able to successfully calm turbulence in the bond market.

    "Assuming the BOJ can get its act together and bring yields down in a stable manner, and the yen stays around 102-103, then all we need is for the market to take some heat out. Today's [Thursday's] move gives it a chance."

    The BOJ conducted a market operation, offering to buy $1.1 billion worth of one-year Japanese bonds, in response to excessive volatility in the market on Thursday.

    To view links or images in signatures your post count must be 15 or greater. You currently have 0 posts.


    Nikita Khrushchev: "We will bury you"
    "Your grandchildren will live under communism."
    “You Americans are so gullible.
    No, you won’t accept
    To view links or images in signatures your post count must be 15 or greater. You currently have 0 posts.
    outright, but we’ll keep feeding you small doses of
    To view links or images in signatures your post count must be 15 or greater. You currently have 0 posts.
    until you’ll finally wake up and find you already have communism.

    To view links or images in signatures your post count must be 15 or greater. You currently have 0 posts.
    ."
    We’ll so weaken your
    To view links or images in signatures your post count must be 15 or greater. You currently have 0 posts.
    until you’ll
    To view links or images in signatures your post count must be 15 or greater. You currently have 0 posts.
    like overripe fruit into our hands."


  4. #84
    Postman vector7's Avatar
    Join Date
    Feb 2007
    Location
    Where it's quiet, peaceful and everyone owns guns
    Posts
    21,663
    Thanks
    30
    Thanked 73 Times in 68 Posts

    Default Re: Financial Crisis - 2013 - ????

    Quote Originally Posted by Malsua View Post
    Watch Copper.

    It's about to get dumped. This means the Chinese are about to take it in the shorts as they use copper for all sorts of collateralization.

    I don't think this will have much impact on the US, in fact, I suspect our markets will continue to run or stay flat even as the Fed begins to hint at the end to QE.
    The Bronze Swan Arrives: Is The End Of Copper Financing China's "Lehman Event"?

    Submitted by Tyler Durden on 05/23/2013 10:06 -0400

    In all the hoopla over Japan's stock market crash and China's PMI miss last night, the biggest news of the day was largely ignored: copper, and the fact that copper's ubiquitous arbitrage and rehypothecation role in China's economy through the use of Chinese Copper Financing Deals (CCFD) is coming to an end.

    Copper, as China pundits may know, is the key shadow interest rate arbitrage tool, through the use of financing deals that use commodities with high value-to-density ratios such as gold, copper, nickel, which in turn are used as collateral against which USD-denominated China-domestic Letters of Credit are pleged, in what can often result in a seemingly infinite rehypothecation loop (see explanation below) between related onshore and offshore entities, allowing loop participants to pick up virtually risk-free arbitrage (i.e., profits), which however boosts China's FX lending and leads to upward pressure on the CNY.

    Since the end result of this arbitrage hits China's current account directly, and is the reason for the recent aberrations in Chinese export data that have made a mockery of China's economic data reporting, China's State Administration on Foreign Exchange (SAFE) on May 5 finally passed new regulations which will effectively end such financing deals.

    The impact of this development can not be overstated: according to independent observers, as well as firms like Goldman, this will not only impact the copper market (very adversely) as copper will suddenly go from a positive return/carry asset to a negative carry asset leading to wholesale dumping from bonded warehouses, but will likely take out a substantial chunk of synthetic shadow leverage out of the Chinese market and economy.

    Naturally, for an economy in which credit creation is of utmost importance, the loss of one such key financing channel will have very unintended consequences at best, and could potentially lead to a significant "credit event" in the world's fastest growing large economy at worst.

    But before we get into the nuts and bolts of how such CCF deals operate, and what this means for systemic leverage, we bring you this friendly note released by Goldman's Roger Yuan overnight, in which Goldman not only quietly cut their long Copper trading recommendation established on March 1 (at a substantial loss), but implicitly went short the metal with a 12 month horizon: a huge shift for a bank that has been, on the surface, calling for a global renaissance in the global economy, and in which Dr. Copper is a very leading indicator of overall economic health and end demand.

    From Goldman:

    Closing: Long LME copper September 2013 contract at $7,482/t, a $236/t (3.1%) loss

    Following the initial sell-off in copper prices in the second half of February 2013, we established a long copper position at $7,718/t in the September contract (on March 1, 2013). We believed that the fall in copper prices, reflecting in part concerns about Chinese activity, was overdone. We reiterated this view on April 22, post further substantial price declines. Since then, prices have rebounded strongly, with the September contract closing at $7,482/t on May 22, up by 10% from the May 1 low of $6,808/t.

    The emergence of the risk that CCFDs unwind over the next 3 months – we had assumed that deals would continue indefinitely – has complicated our near-term bullish copper view (from current prices). On the one hand, our fundamental short-term thesis is playing out – copper inventories are drawing, copper’s main end-use markets in China are growing solidly (property sales +39% yoy, completions +7% yoy, auto’s output +14% yoy Jan-April 2013), seasonal factors are currently supportive, Chinese scrap availability is tight, positioning also remains short, and policy risks are, arguably, mildly skewed to the upside.

    Set against this is the likely near-term unwind in CCFDs and, critically, our view that copper is headed into surplus in 2014 (the window for higher copper prices is shortening). On net, we now see the risks to our 6-mo forecast of $8,000/t as skewed to the downside, and, in this context, we unwind our September long copper position at $7,482/t, a $236/t (3.1%) loss, given the recent strong rally in LME prices to near our 3-mo target of $7,500/t. Additionally, we believe that a further rally in copper prices in the near term would be a good selling opportunity taking a 12-month view [ZH: translated: short it].

    Consumers: We believe that consumers will have a better opportunity to enter the copper market to buy taking a 12-month view. Following the recent sharp sell-off in zinc we are increasingly bullish on the outlook from current prices and as such believe consumers should take advantage of current low levels.

    Producers: Our base case of a sharp slowdown in growth of Chinese construction completions in 2014, in the context of above-trend supply growth, presents significant longer-term downside risks to global copper demand growth and prices. Therefore we continue to believe that any further rallies in the copper price in 2013 represent a good opportunity to hedge, and in our view other non-producer market participants should continue to monitor any copper positions in light of the 2014 downside risks.


    So just what is the significance of CCFDs? As it turns out, it is huge. Goldman explains (get a cup of coffee first: this is not a simple walk-thru):

    The combination of Chinese capital controls and a significant positive domestic (CNY) to foreign (USD) interest rate differential has, in recent years, resulted in the development and implementation of large scale ‘financing deals’ which legally arbitrage the interest rate differential via China’s current account. These Chinese ‘financing deals’ typically use commodities with high value-to-density ratios such as gold, copper, nickel and ‘high-tech’ goods, as a tool to enable interest rate arbitrage. With the notional value of the deals far exceeding the export/import value of the commodities used, and likely significantly contributing to the recent run-up in China’s short-term FX lending (and related upward pressure on the CNY), China’s State Administration of Foreign Exchange (SAFE) announced new regulations to address these issues (May 5), to be implemented in June. Goldman continues:


    SAFE’s new policies are, in our view, likely to bring these Chinese ‘financing deals’ to an end over the next 1-3 months. Having said this, some uncertainty remains around the implementation of the new policies by SAFE and Chinese banks, the speed at which the policies impact the market, and the possibility that new financing deals are “invented”. Owing to these uncertainties, a complete unwind of CCFDs is still at this point considered a risk.
    In this note we provide a full example of a typical deal and discuss our understanding of the impact of an unwind in Chinese Copper Financing Deals (CCFDs) 1 on the copper market.

    Our view is that the bulk of copper stored in bonded warehouses in China – at least 510,000t at present, as well as some inbound copper shipments into China – is being used to unlock the CNY-USD interest rate differential. This material has not been entirely unavailable to the market (deals can be broken if costs rise, such as a tightening of LME spreads), but the inventory has been effectively financed by factors exogenous to the copper market for some time.

    We find that a complete unwind of CCFDs would be bearish for copper prices as the copper used to unlock the differential would shift from being a positive return/carry asset to a negative carry asset for those who currently hold it. As such this inventory will likely become more ‘available’ to the global market. Initially stocks would likely move into the Chinese domestic market to ease the current tightness, until the current SHFE price premium to LME closes.

    After the SHFE-LME price arbitrage closes sufficiently, the remaining bonded stock (over and above day-to-day working flows) would likely shift from bonded warehouses to the LME. We expect that the ex-China (LME) market would likely see inventory increases as a result, as China draws on bonded stocks instead of importing and as excess bonded stocks are shifted back on to the LME. We estimate that the ex-China market will need to ‘carry’ a minimum of 200-250kt of additional physical copper over the coming months, equivalent to 4%-5% of quarterly global supply. The latter would most likely result in a widening contango, including downward pressure on cash prices.

    Specifically, the current LME 3-15 month contango is 1.1%, compared to full carry of c.3%-3.5%.

    The emergence of this bearish risk – we had assumed that deals would continue indefinitely – complicates our near-term bullish copper view. Indeed, our fundamental short-term thesis is unfolding – copper inventories are drawing, copper’s main end-use markets in China are growing solidly (property sales +39% yoy, completions +7% yoy, auto’s output +14% yoy over the Jan-April 2013 period), seasonal factors are currently supportive, and scrap availability in China is reportedly tight. Positioning also remains short, and policy risks may be mildly skewed to the upside (ECB meeting June 6 and FOMC meeting June 18-19).

    The other factors that have recently supported a rebound in copper prices have been mine supply disruptions at Grasberg in Indonesia (c.480kt for 2013E), and the threat of further strikes in Chile ahead of the Chilean elections and at Grasberg ahead of contract negotiations (the current labour contract ends in September). Our forecast 2013 disruption allowance of 5.8%, or c.900kt is designed to account for these kinds of developments, and so far this year our allowance looks reasonable, meaning that these disruptions are not set to impact our overall balance forecast.

    Set against this is the likely near-term unwind in CCFDs and, critically, our view that copper is headed into significant surplus in 2014 (the window for higher prices is shortening). On net, we now see the risks to our 6-mo forecast of $8,000/t as skewed to the downside. In this context, we unwind our September long copper recommendation at $7,482/t, a 3% loss.
    If you haven't shorted copper after reading the above.... we suggest you re-read it.

    Ploughing on: below is the reason for SAFE's new dramatic regulations, and why China decided to go ahead and kill CCFD, unintended consequences, whatever they may be, be damned:


    China’s foreign currency reserves have risen significantly since the start of the year, placing upward pressure on the CNY (Exhibit 1). This development prompted SAFE, China’s regulator of cross-border transactions, to announce a new set of regulations on May 5, to be implemented in June.


    The new regulations can be split into two parts, and broadly summarised as follows:

    a) The first measure targets Chinese bank balance sheets. This measure aims to:

    i) Directly reduce the scale of China’s FX loans, thus reducing the scale of letter of credit (LC) financing (bank loans), thereby reducing the volume of funding available for CCFDs (though not specifically targeting CCFDs); and/or

    ii) Raise banks’ FX net open positions (banks are required to hold a minimum net long FX position at the expense of CNY liabilities), thus raising LC financing costs, thereby increasing the cost of funding CCFDs.

    Specifically, Exhibit 2 shows that SAFE aims to implement a bank loan to bank deposit ratio of 75%-100% going forward, compared to an existing ratio of >150%.


    b) The second measure targets exporters and/or importers (‘trade firms’) by identifying any activities that mainly result in FX inflows above normal export/import backed activities (i.e. trades for the purpose of interest rate arbitrage, amongst others). This measure would force entities to curb their balance sheets if they are found to be involved in such activities.

    Since May10 SAFE has been requesting ‘trade firms’ provide detailed information of their balance sheets and trading records, in order to categorize them as either A-list or B-list firms by June 1, 2013. B-list firms will be required to reduce their balance sheet significantly by cutting any capital inflow related trade activities.

    To avoid being categorized as a B-list firm by SAFE, ‘trade firms’ may reduce their USD LC liabilities in the near term, with CCFDs likely impacted. It is not yet clear what happens to the B-list firms once they are categorized as such. However, if B-list firms were prohibited from rolling their LC liabilities this could increase the pace of the CCFD unwind, since these trade firms would likely need to sell their liquid assets (copper included) to fund their LC liabilities accumulated through previous CCFDs.

    These new regulations are likely to impact a number of markets and market participants. In this note we focus on the impact on CCFDs and the copper market. Should a) and b) be enforced, copper financing deals are highly likely to be impacted.
    * * *
    That explains China's macro thinking. But what does it mean for the actual Copper Financing Deal? The below should explain it:


    An example of a typical, simplified, CCFD

    In this section we present an example of how a typical Chinese Copper Financing Deal (CCFD) works, and then discuss how the various parties involved are affected if the deals are forced to unwind. Exhibit 3 is a ‘simplified’ example of a CCFD, including specific reference to how the process places upward pressure on the RMB/USD. We believe this is the predominant structure of CCFDs, with other forms of Chinese copper financing deals much less profitable and likely only a small proportion of total deal volumes.

    A typical CCFD involves 4 parties and 4 steps:

    • Party A – Typically an offshore trading house
    • Party B – Typically an onshore trading house, consumers
    • Party C – Typically offshore subsidiary of B
    • Party D – Onshore or offshore banks registered onshore serving B as a client


    Step 1) offshore trader A sells warrant of bonded copper (copper in China’s bonded warehouse that is exempted from VAT payment before customs declaration) or inbound copper (i.e. copper on ship in transit to bonded) to onshore party B at price X (i.e. B imports copper from A), and A is paid USD LC, issued by onshore bank D. The LC issuance is a key step that SAFE’s new policies target.


    Step 2) onshore entity B sells and re-exports the copper by sending the warrant documentation (not the physical copper which stays in bonded warehouse ‘offshore’) to the offshore subsidiary C (N.B. B owns C), and C pays B USD or CNH cash (CNH = offshore CNY). Using the cash from C, B gets bank D to convert the USD or CNH into onshore CNY, and trader B can then use CNY as it sees fit.

    The conversion of the USD or CNH into onshore CNY is another key step that SAFE’s new policies target. This conversion was previously allowed by SAFE because it was expected that the re-export process was a trade-related activity through China’s current account. Now that it has become apparent that CCFDs and other similar deals do not involve actual shipments of physical material, SAFE appears to be moving to halt them.

    Step 3) Offshore subsidiary C sells the warrant back to A (again, no move in physical copper which stays in bonded warehouse ‘offshore’), and A pays C USD or CNH cash with a price of X minus $10-20/t, i.e. a discount to the price sold by A to B in Step 1.

    Step 4) Repeat Step 1-Step 3 as many times as possible, during the period of LC (usually 6 months, with range of 3-12 months). This could be 10-30 times over the course of the 6 month LC, with the limitation being the amount of time it takes to clear the paperwork. In this way, the total notional LCs issued over a particular tonne of bonded or inbound copper over the course of a year would be 10-30 times the value of the physical copper involved, depending on the LC duration.

    Copper ownership and hedging: Through the whole process each tonne of copper involved in CCFDs is hedged by selling futures on LME futures curve (deals typically involve a long physical position and short futures position over the life of the CCFDs, unless the owner of the copper wants to speculate on the price).

    Though typically owned and hedged by Party A, the hedger can be Party A, B, C and D, depending on the ownership of the copper warrant.

    As Goldman further explains, the importance of CCFD is "not trivial" - that is an understatement: with the implicit near-infinite rehypothecation in which the number of "circuits" in the deal is only a factor of "the amount of time it takes to clear the paperwork", there may be hundreds of billions, if not more, in leverage resulting from this shadow transaction that has been used in China for years. Now, that loop is about to end. The reality is nobody can predict what the impact will be, but whatever it is - i) it will extract tremendous leverage from the system and ii) it will have adverse impacts on both China's ability to absorb inflation and grow its economy.


    How important are CCFDs? They are not trivial!

    Chinese ‘financing deals’, including CCFDs, are likely to contribute to China’s FX inflows since they involve direct FX inflows through China’s current account. Specifically, for CCFDs, the immediate cross-border conversion of FX to onshore CNY after Party C pays Party B for the copper warrant (Step 2) directly contributes to China’s FX inflows. In terms of outflows, the issuance of LC (FX short-term lending) by Party D to Party A (Step 1) is not associated FX outflow by definition, and when the LCs expire they tend to be rolled forward. Step 3 occurs offshore, so there is no inflow/outflow related to this transaction.

    In this way, the net Chinese FX inflows/outflows associated with CCFDs are equivalent to the change in the value of the notional LCs. We make some broad estimates of how much of China’s short-term FX lending could be accounted for by CCFDs.

    Specifically, our best estimate suggests that roughly 10% of China’s short-term FX lending could have been associated with CCFDs since the beginning of 2012 (Exhibit 4). In April 2013, we estimate that CCFDs accounted for $35-40 bn (stock) of China’s total short-term FX lending of $384 bn (stock), making various assumptions. More broadly, Chinese bonded inventories and short-term FX lending has been positively correlated in recent years (Exhibit 5).


    Two key questions remain: how the upcoming unwind will impact each CCFD participant entity...

    How an unwind may impact each CCFD participant

    As we discussed on pages 4 and 5, SAFE’s new regulations target both banks’ LC issuance (first measure) and ‘trade firms’ trade activities (second measure). Here we discuss how the different entities (A, B, C, D) would likely adjust their portfolios to meet the new regulations (i.e. what happens in a complete unwind scenario).

    Party A: Party A, without the prospect of $10-20/t profit per Step 1-3 iteration, is likely to find it hard to justify having bonded copper sitting on its balance sheet (the current LME contango is not sufficient to offset the rent and interest costs). As a result, Party A’s physical bonded copper would likely become ‘available’, and Party A would likely unwind its LME short futures hedge.

    Party B, C: To avoid being categorized as a B-list firm by SAFE, Party B and C may reduce their USD LC liabilities by: 1) selling liquid assets to fund the USD LC liabilities, and/or 2) borrowing USD offshore and rolling LC liabilities to offshore USD liabilities. The broad impact of this is to reduce outstanding LCs, and CCFDs will likely be affected by this. It is not yet clear what happens to the B-list firms in detail once they are categorized as such. However, if B-list firms were prohibited from rolling their LC liabilities this would increase the pace of the CCFDs unwind. In this scenario, these trade firms would have to sell their liquid assets (copper included) to fund their LC liabilities accumulated through previous CCFDs.

    Party D: To meet SAFE’s regulations, Party D will likely adjust their portfolios by reducing LC issuance and/or increasing FX (mainly USD) net long positions, which would directly reduce the total scale of CCFDs and/or raise the LC financing cost, respectively.
    ... And what happens to copper prices (hint: GTFO)

    Implications for copper - bonded copper moves from a positive carry asset to negative carry asset


    Implications for copper - bonded copper moves from a positive carry asset to negative carry asset

    We expect that a complete unwind of CCFDs, everything else equal, is likely to be bearish for copper prices, LME spreads, and bonded premiums.

    CCFDs involve a long copper physical positions and a short futures position on the LME. The physical position would be sold if CCFDs unwound and the short futures positions bought back. The newly available physical copper would not be financed by the China and ex-China interest rate differential anymore (not a positive carry asset anymore), and would instead need to be financed by a natural contango (in the interim copper becomes a negative carry asset), everything else equal.

    Theoretically then, the physical market, over a short period (say, one quarter), may need to absorb as much as c.400kt of copper, equivalent to 8% of quarterly global copper supply.

    By contrast, the LME futures market would need to absorb buying of c.0.2%-0.3% of quarterly traded LME volumes and c.6% of daily average 2012 open interest. The impact on the physical market is therefore likely to be relatively large, in spite the fact that an unwind of CCFDs does not result in the creation of new copper (i.e. aggregate global copper inventory impact is 0/our inventory chart does not change).

    What about in practice?

    Since there are no comparable historical examples to make reference to, what happens when CCFDs unwind in practice is open for debate. We believe that since the downward pressure on the physical market is large, both in absolute terms and relative to the upward pressure on the futures market, near-term prices are likely to come under relatively significant pressure. Further, if the market fears the unwind of CCFDs, physical buyers may hold off on purchases, and futures sellers may bet on lower prices (offsetting either in part or more than offsetting the financing deal related unwind buying). In this way it is likely that in practice the whole copper price curve would be under pressure in the case of a complete CCFD unwind, at least until the contango widens sufficiently to compensate for the cost of carry.

    We see the following as a likely chain of events in a complete unwind scenario:


    • China would draw on bonded until it is ‘full’. In the current market bonded copper stocks will likely initially flow into the domestic Chinese market, since SHFE prices are above LME prices, with the SHFE curve in backwardation and LME in contango.
    • Chinese imports fall/remain low, placing upward pressure on LME stocks. Since China is drawing bonded inventories to meet its demand, Chinese copper imports are likely to be under downward pressure beyond May, resulting in any excess material ex-China turning up on the LME as well (Exhibit 7). Remaining bonded stocks (ex-stocks in transit), would shift to LME. Once China is ‘full’ (i.e. the import arbitrage closes, bonded physical premia decline, SHFE price and curve softens), the remaining excess bonded inventory will likely make its way on to the LME. Since China is in deficit at present (drawing bonded and SHFE inventories, SHFE in backwardation), due in part to seasonal factors, the inventory numbers noted above, in practice, will likely be smaller but still very large. Our best estimate would be a minimum of 200,000-250,000t of stock could shift/build on the LME over the next 2-3 months, or 4%-5% of quarterly global consumption.
    • LME contango to widen. Higher LME stocks suggest higher LME copper spreads, including downward pressure on the front end. Exhibit 8 illustrates that over the last 6 years, the buildup of LME inventory has been consistently associated with widening LME spreads into contango, and the scale of contango is mostly driven by financing cost and inventory levels. With excess copper flowing into LME warehouses, the spread needs to widen further to finance the carry trade effectively. For reference, LME annual rents are c.$150/t or 2% of copper prices. Assuming an annualized financing cost of 1%-1.5%, full carry is c.3%-3.5%, compared to current LME 3-15 month contango of 1.1%.


    The main caveat to the above is that a complete unwind in CCFDs is still subject to the implementation of the policy by SAFE, Chinese banks and ‘trade firms’, and the possibility that new financing deals are “invented”. As a result, we will continue to closely monitor implementation of the policy by banks via monitoring bonded physical premiums, SHFE spreads and bonded stock flows.


    Finally, what does all this mean for explicit rehypothecation chain leverage (initially just at the CCFD level although a comparable analysis must be done for systemic as well) and CCFD risk exposure:


    Leverage in CCFDs

    Below is a demonstration of the LC issuance process in a typical CCFD. Assuming an LC with a duration of 6 months, and 10 circuit completions (of Step 1-3) during that time (i.e. one CCFD takes 18 days to complete), Party D is able to issue 10 times the copper value equivalent in the form of LCs during the first 6 month LC (as shown from period t1 to t10 in Exhibit 10). In the proceeding 6 months (and beyond), the total notional value of the LCs remains the same, everything else equal, since each new LC issued is offset by the expiration of an old one (as shown from period t11 to t20).

    In this example, total notional amount of LC during the life of the LC = LC duration / days of one CCFD completion* copper value = 10. In this example, the total notional amount of LC issued by Party D, total FX inflow through Party D from party A, and total CNY assets accumulated by party B (and C) are all 10 times the copper value (per tonne).

    To raise the total notional value of LCs, participants could:


    • Extend the LC duration (for example, if LC duration in our model is 12 months, the notional LC could be 20 times copper value)
    • Raise the no. of circuits by reducing the amount of time it takes to clear the paperwork
    • Lock in more copper


    Risk exposures of parties to CCFDs

    Theoretically, Party B risk exposure > Party D risk exposure > Party A risk exposure


    • Party B’s risks are duration mismatch (LC against CNY assets) and credit default of their CNY assets;
    • Party D’s risks are the possibility that party B has severe financial difficulties. (they manage this risk by controlling the total CNY and FX credit quota to individual party B based on party B’s historical revenue, hard assets, margin and government guarantee) (Party D has the right to claim against party B (onshore entity), because party B owes party D short term FX debt (LC)). If party B were to have financial difficulties, party D can liquidate Party B’s assets.
    • Party A’s risk is mainly that party D (China’s banks) have severe financial difficulties (Party A has the right to claim against party D (onshore banks), because Party A (or Party A’s offshore banks) holds an LC issued by party D). In the case of financial difficulties for Party B, and even in case Party D has difficulties, Party A can still get theoretically get paid by party D (assuming Party D can borrow money from China’s PBoC).


    In brief (pun intended): a complete, unpredictable clusterfuck accompanied by wholesale liquidations of "liquid assets", deleveraging and potentially a waterfall effect that finally bursts China's bubble, all due to a simple black swan. Although, in reality, nobody knows. Just like nobody knew what would happen when the government decided to let Lehman fail.

    So... is this China's Lehman?

    To view links or images in signatures your post count must be 15 or greater. You currently have 0 posts.


    Nikita Khrushchev: "We will bury you"
    "Your grandchildren will live under communism."
    “You Americans are so gullible.
    No, you won’t accept
    To view links or images in signatures your post count must be 15 or greater. You currently have 0 posts.
    outright, but we’ll keep feeding you small doses of
    To view links or images in signatures your post count must be 15 or greater. You currently have 0 posts.
    until you’ll finally wake up and find you already have communism.

    To view links or images in signatures your post count must be 15 or greater. You currently have 0 posts.
    ."
    We’ll so weaken your
    To view links or images in signatures your post count must be 15 or greater. You currently have 0 posts.
    until you’ll
    To view links or images in signatures your post count must be 15 or greater. You currently have 0 posts.
    like overripe fruit into our hands."


  5. #85
    Expatriate American Patriot's Avatar
    Join Date
    Jul 2005
    Location
    A Banana Republic, Central America
    Posts
    48,612
    Thanks
    82
    Thanked 28 Times in 28 Posts

    Default Re: Financial Crisis - 2013 - ????

    Home price rise sets seven-year record in March: S&P


    NEW YORK | Tue May 28, 2013 9:27am EDT


    (Reuters) - U.S. single-family home prices rose in March, racking up their best annual gain in nearly seven years in a further sign that the strengthening housing recovery is providing a source of support for the economy, a closely watched survey showed on Tuesday.


    The S&P/Case Shiller composite index of 20 metropolitan areas gained 1.1 percent in March on a seasonally adjusted basis, topping economists' forecasts for a 1 percent rise.


    Prices in the 20 cities jumped 10.9 percent year over year, beating expectations for 10.2 percent. This was the biggest increase since April 2006, just before prices peaked in the summer of that year.


    All 20 cities covered by the index saw yearly gains for the third month in a row. Average prices in March were back at their late-2003 levels.


    Prices in Phoenix continued their sharp ascent, rising 22.5 percent from a year earlier. Other standouts included San Francisco, up 22.2 percent, and hard-hit Las Vegas, up 20.6 percent.


    The housing market turned a corner in 2012, several years after its far-reaching collapse. The recovery has picked up since as inventory tightened, foreclosures eased and historically low mortgage rates have attracted buyers.


    For the first quarter of this year, the seasonally adjusted national index rose 3.9 percent, stronger than the 2.4 percent gain of the final quarter of last year.


    The data provoked little reaction in financial markets. Wall Street was poised to open higher as comments from central banks around the world reassured investors that supportive monetary policies would remain in place.
    Libertatem Prius!


    To view links or images in signatures your post count must be 15 or greater. You currently have 0 posts.


  6. #86
    Creepy Ass Cracka & Site Owner Ryan Ruck's Avatar
    Join Date
    Jul 2005
    Location
    Cincinnati, OH
    Posts
    25,061
    Thanks
    52
    Thanked 78 Times in 76 Posts

    Default Re: Financial Crisis - 2013 - ????

    There has been a slight rebound in prices due to some people who still have enough money snapping up homes that have been at bargain basement prices and, because rates are at historically low levels and could end up rising any day.

  7. #87
    Expatriate American Patriot's Avatar
    Join Date
    Jul 2005
    Location
    A Banana Republic, Central America
    Posts
    48,612
    Thanks
    82
    Thanked 28 Times in 28 Posts

    Default Re: Financial Crisis - 2013 - ????

    I'm expecting that... (rates to rise on loans).

    We're feverishly working to get the house on the market. I need to finish a lot of little stupid projects (all of them combines should take me a week if I had a solid week, but I'm doing an hour here, and two there). Before we can get an appraisal I have to have all this crap done. Before I get a realtor (or hire them) I need to get the appraisal done. I have to have an inspection of the heating system and have to have it cleaned. We're almost there.

    Just a few more days I think.

    Either way, I'm trying to get the timing right and it's ALL "gut instinct" at this point since I'm a complete novice at selling a house. Only owned this one. Never sold one.
    Libertatem Prius!


    To view links or images in signatures your post count must be 15 or greater. You currently have 0 posts.


  8. #88
    Creepy Ass Cracka & Site Owner Ryan Ruck's Avatar
    Join Date
    Jul 2005
    Location
    Cincinnati, OH
    Posts
    25,061
    Thanks
    52
    Thanked 78 Times in 76 Posts

    Default Re: Financial Crisis - 2013 - ????


    The Next Real Estate Bubble: Farmland

    Farmers have been taking on mounting debt, creating an unsustainable increase in land prices and risking a crash that would ripple through our economy.

    March 29, 2013

    Eeyore should have been a farmer. It’s almost impossible to find a farmer happy about his situation. The weather’s too hot, cold, wet, or dry, and prices are too low or too high, depending on whether we’re buying or selling. We can’t, at least in front of our peers, admit to prosperity or even the chance of prosperity. Although we’d never admit it at the local coffee shop, the last few years have been good, at least for Midwestern grain farmers. Prices have been strong — strong enough to make up for much of the production lost to last year’s drought. That’s terrible news for livestock producers, who’ve been faced with drought-damaged pastures and high feed costs, but for farmers producing corn and soybeans, it has been a profitable few years.

    Farmers have cash, and nowhere to invest it but farmland. Farmers largely ignore equities, as they tend to balance the inherent risk in farming by investing in what they perceive as less risky places. We aren’t dumb, however, and have figured out that it's a losing game to invest in bonds or CDs at rates less than inflation while we’re in tax brackets we never even knew existed.

    So, farmland prices are booming. Land prices in the heart of the Corn Belt have increased at a double-digit rate in six of the last seven years. According to Federal Reserve studies, farmland prices were up 15 percent last year in the most productive part of the Corn Belt, and 26 percent in the western Corn Belt and high plains. Closer to home, a neighbor planning his estate had an appraisal done in 2010 and again in late 2012. In that two-year period, the value of his farm had doubled. According to Iowa State economist Mike Duffy, Iowa land selling for $2,275 per acre a decade ago is now at $8,700 per acre. A farm recently sold in Iowa for $21,900 per acre.

    Although much of the increase in land prices has been driven by well-financed farmers and outside investors (many paying a large portion of the purchase price in cash), there are disturbing trends occurring on farm balance sheets. The Kansas Farm Management Association reports that debt-to-equity ratios are highest in large farms, which have over a million dollars in sales. Although the debt-to-asset ratio is low even in the largest farms in Kansas, it's higher than it was in 1979, shortly before the farmland crash of the eighties. As former home owners in Las Vegas and Southern California can attest, equity can melt away in a hurry. A debt-to-asset ratio of 30 percent can enter dangerous territory with a land price drop of 50 percent, which sounds like a lot, until you remember that is a price level last seen only 24 months ago in much of the Midwest.

    The number of farmers in the Kansas survey with a 40 percent debt-to-asset ratio is higher now than it was in 1979, and those farms with a debt-to-asset ratio of over 70 percent are three times as numerous today.

    We farmers should be more sophisticated than the average subprime borrower and more risk averse than startup investors in the 1990s. After all, we manage multi-million dollar businesses, and since the average age of farmers is near 60, most of us are survivors of the agricultural asset crash of the early 1980s. In 1981, the average price of farmland in Iowa was $2,147 per acre; by 1986, the average farm brought $787 an acre. That period was the formative experience of my farming career, and one I would not wish to repeat. According to a recent article in the USA Today, a third of Iowa’s farmers left the industry during that crash.

    In a population thus inoculated, we ought not to catch the fever again. It is a mark of the few investment choices left to farmers that we’ve so eagerly contributed to this unsustainable increase in land prices. We know better, we know it’s likely to end badly, but we don’t feel that we have an alternative.

    A personal admission here. We bought our neighbor’s farm a couple of years ago. Yes, I know better, but we’ve had our eye on that farm for a generation.

    Interest rates are low because the Federal Reserve believes that low interest rates are the best way to help heal an ailing economy, or at least the best tool available to the Federal Reserve. Our economy is so fragile and our major banks so tenuously financed that the Fed thinks it has no choice but to risk a repeat of the early 1980s bubble in farmland, the 1990s tech boom, and the recent housing market bust.

    A cynic might also notice that low interest rates are extremely important to large borrowers, and the largest of all borrowers is the federal government. Need an example of the impact that an increase in the interest rate will have on the federal budget? The sequester — which has caused the White House to cut tours, is increasing lines at airports, and means that Yellowstone National Park will open later than normal this spring — requires budget cuts of around $85 billion. Even a 1 percent increase in the interest rate would eventually increase federal borrowing costs by $160 billion annually; more normal borrowing costs are around 5 percent.

    We can argue over what economic policy works best, but the one thing we can be sure of is this: the federal government and the Federal Reserve are not working with a scalpel, but rather performing surgery on the economy with a chain saw. No one should expect our present monetary policy to be unwound in such a manner that farmland prices can be gently slowed to a more sustainable path — one that reflects the slow but steady increase in demand for food and fiber.

    The federal government spent billions of dollars in the 1980s supporting farm income and writing off bad debts from various government farm lending programs. Those resources clearly aren’t available today, and agriculture is facing a grim future.

    The Kansas City Federal Reserve recently had a symposium examining whether we are experiencing a farmland bubble. Bubbles are impossible to truly define until they burst, but when the Fed is sponsoring seminars on the topic, it occurs to this Eeyore that straws may well be floating in the wind. The ripples from a crash in farmland prices would not have the long-lasting effects on the economy that the subprime debacle did, but the chance of a crash in farmland prices should still concern policymakers. Farmers may well be collateral damage in the quantitative easing battle and are rightly worried that the next victim of our monetary policy will be wearing overalls when the music stops.

  9. #89
    Creepy Ass Cracka & Site Owner Ryan Ruck's Avatar
    Join Date
    Jul 2005
    Location
    Cincinnati, OH
    Posts
    25,061
    Thanks
    52
    Thanked 78 Times in 76 Posts

    Default Re: Financial Crisis - 2013 - ????


    Private-Payrolls Growth Slows

    The gain in private-sector jobs was the smallest since October

    April 3, 2013


    Private-payroll growth slowed in March, posting the smallest gain since October, Automatic Data Processing Inc. reported Wednesday morning.

    ADP, a payrolls processor, reported the economy gained 158,000 private jobs in March, compared with an upwardly revised gain of 237,000 in February.

    The job market is improving in “fits and starts,” said Mark Zandi, chief economist of Moody’s Analytics, which produces the report.

    “Construction employment gains paused as the rebuilding surge in the wake of Superstorm Sandy ended,” Zandi said. “Anticipation of health-care reform may also be weighing on employment at companies with close to 50 employees.”

    Economists polled by MarketWatch had expected the report to show the U.S. economy gained 215,000 private-payroll jobs in March, up from an original estimate of 198,000 in February. U.S. stock index futures gave up minor gains after the ADP report.

    ADP’s report comes on the heels of other disappointing data on consumer confidence and manufacturing.

    “They hint that a strong [first quarter] in the U.S. economy may have seen a loss of momentum in its final month, boding less well for [the second quarter,” wrote economist Avery Shenfeld at CIBC World Markets in a research note.

    Markets look to the report on private-sector payrolls to provide some guidance on the U.S. Department of Labor’s jobs estimate, which will be released Friday and includes information on both private- and public-sector payrolls. Economists polled by MarketWatch expect the government to report nonfarm-payroll employment rose 195,000 in March, down from a gain of 236,000 in February. Economists also expect the unemployment rate remained at 7.7%.

    While recent employment data have shown steady gains, the labor market remains far below its peak, as there are more than three million fewer jobs in the U.S. than when the recession began. Looking forward, economists say the large federal spending cuts could curb growth in coming months.

    According to the details of ADP’s private-employment report, small businesses added 74,000 jobs, medium businesses added 37,000, and large businesses added 47,000. Service providers added 151,000 jobs, while goods producers added 7,000.

  10. #90
    Creepy Ass Cracka & Site Owner Ryan Ruck's Avatar
    Join Date
    Jul 2005
    Location
    Cincinnati, OH
    Posts
    25,061
    Thanks
    52
    Thanked 78 Times in 76 Posts

    Default Re: Financial Crisis - 2013 - ????

    What's that definition of "insanity" again?


    Obama Administration Pushes Banks To Make Home Loans To People With Weaker Credit

    April 2, 2013

    The Obama administration is engaged in a broad push to make more home loans available to people with weaker credit, an effort that officials say will help power the economic recovery but that skeptics say could open the door to the risky lending that caused the housing crash in the first place.

    President Obama’s economic advisers and outside experts say the nation’s much-celebrated housing rebound is leaving too many people behind, including young people looking to buy their first homes and individuals with credit records weakened by the recession.

    In response, administration officials say they are working to get banks to lend to a wider range of borrowers by taking advantage of taxpayer-backed programs — including those offered by the Federal Housing Administration — that insure home loans against default.

    Housing officials are urging the Justice Department to provide assurances to banks, which have become increasingly cautious, that they will not face legal or financial recriminations if they make loans to riskier borrowers who meet government standards but later default.

    Officials are also encouraging lenders to use more subjective judgment in determining whether to offer a loan and are seeking to make it easier for people who owe more than their properties are worth to refinance at today’s low interest rates, among other steps.

    Obama pledged in his State of the Union address to do more to make sure more Americans can enjoy the benefits of the housing recovery, but critics say encouraging banks to lend as broadly as the administration hopes will sow the seeds of another housing disaster and endanger taxpayer dollars.

    “If that were to come to pass, that would open the floodgates to highly excessive risk and would send us right back on the same path we were just trying to recover from,” said Ed Pinto, a resident fellow at the American Enterprise Institute and former top executive at mortgage giant Fannie Mae.

    Administration officials say they are looking only to allay unnecessary hesi*ta*tion among banks and encourage safe lending to borrowers who have the financial wherewithal to pay.

    “There’s always a tension that you have to take seriously between providing clarity and rules of the road and not giving any opportunity to restart the kind of irresponsible lending that we saw in the mid-2000s,” said a senior administration official who was not authorized to speak on the record.

    The administration’s efforts come in the midst of a housing market that has been surging for the past year but that has been delivering most of the benefits to established homeowners with high credit scores or to investors who have been behind a significant number of new purchases.

    “If you were going to tell people in low-income and moderate-income communities and communities of color there was a housing recovery, they would look at you as if you had two heads,” said John Taylor, president of the National Community Reinvestment Coalition, a nonprofit housing organization. “It is very difficult for people of low and moderate incomes to refinance or buy homes.”

    Before the crisis, about 40 percent of home buyers were first-time purchasers. That’s down to 30 percent, according to the National Association of Realtors.

    From 2007 through 2012, new-home purchases fell 30 percent for people with credit scores above 780 (out of 800), according to Federal Reserve Governor Elizabeth Duke. But they declined 90 percent for people with scores between 680 and 620 — historically a respectable range for a credit score.

    “If the only people who can get a loan have near-perfect credit and are putting down 25 percent, you’re leaving out of the market an entire population of creditworthy folks, which constrains demand and slows the recovery,” said Jim Parrott, who until January was the senior adviser on housing for the White House’s National Economic Council.

    One reason, according to policymakers, is that as young people move out of their parents’ homes and start their own households, they will be forced to rent rather than buy, meaning less construction and housing activity. Given housing’s role in building up a family’s wealth, that could have long-lasting consequences.

    “I think the ability of newly formed households, which are more likely to have lower incomes or weaker credit scores, to access the mortgage market will make a big difference in the shape of the recovery,” Duke said last month. “Economic improvement will cause household formation to increase, but if credit is hard to get, these will be rental rather than owner-occupied households.”

    Deciding which borrowers get loans might seem like something that should be left up to the private market. But since the financial crisis in 2008, the government has shaped most of the housing market, insuring between 80 percent and 90 percent of all new loans, according to the industry publication Inside Mortgage Finance. It has done so primarily through the Federal Housing Administration, which is part of the executive branch, and taxpayer-backed mortgage giants Fannie Mae and Freddie Mac, run by an independent regulator.

    The FHA historically has been dedicated to making homeownership affordable for people of moderate means. Under FHA terms, a borrower can get a home loan with a credit score as low as 500 or a down payment as small as 3.5 percent. If borrowers with FHA loans default on their payments, taxpayers are on the line — a guarantee that should provide confidence to banks to lend.

    But banks are largely rejecting the lower end of the scale, and the average credit score on FHA loans has stood at about 700. After years of intensifying investigations into wrongdoing in mortgage lending, banks are concerned that they will be held responsible if borrowers cannot pay. Under some circumstances, the FHA can retract its insurance or take other legal action to penalize banks when loans default.

    “The financial risk of just one mistake has just become so high that lenders are playing it very, very safe, and many qualified borrowers are paying the price,” said David Stevens, Obama’s former FHA commissioner and now the chief executive of the Mortgage Bankers Association.

    The FHA, in coordination with the White House, is working to develop new policies to make clear to banks that they will not lose their guarantees or face other legal action if loans that conform to the program’s standards later default. Officials hope the FHA’s actions will then spur Fannie and Freddie to do the same.

    The effort requires sign-on by the Justice Department and the inspector general of Department of Housing and Urban Development, agencies that investigate wrongdoing in mortgage lending.

    “We need to align as much as possible with IG and the DOJ moving forward,” FHA Commissioner Carol Galante said. The HUD inspector general and Justice Department declined to comment.

    The effort to provide more certainty to banks is just one of several policies the administration is undertaking. The FHA is also urging lenders to take what officials call “compensating factors” into account and use more subjective judgment when deciding whether to make a loan — such as looking at a borrower’s overall savings.

    “My view is that there are lots of creditworthy borrowers that are below 720 or 700 — all the way down the credit-score spectrum,” Galante said. “It’s important you look at the totality of that borrower’s ability to pay.”

  11. #91
    Creepy Ass Cracka & Site Owner Ryan Ruck's Avatar
    Join Date
    Jul 2005
    Location
    Cincinnati, OH
    Posts
    25,061
    Thanks
    52
    Thanked 78 Times in 76 Posts

    Default Re: Financial Crisis - 2013 - ????


    Where The Jobs Were In April

    May 3, 2013

    For those lucky enough to not be male and aged 25-54, and having been able to get a job in April, the following chart is redundant. For everyone else, curious which industries were adding jobs in April, here is the full breakdown. With the bulk of job additions in such "high paying" sectors as leisure and hospitality, temp help and retail, one can see why corporate revenues are going nowhere fast.


  12. #92
    Creepy Ass Cracka & Site Owner Ryan Ruck's Avatar
    Join Date
    Jul 2005
    Location
    Cincinnati, OH
    Posts
    25,061
    Thanks
    52
    Thanked 78 Times in 76 Posts

    Default Re: Financial Crisis - 2013 - ????


    Philadelphia, 5th Largest City in US is Effectively Bankrupt; Mayor Holds Closed Meeting With Wall Street to Discuss Asset Sales

    April 16, 2013

    You know a city is in deep trouble when its mayor invites Wall Street but not the press and not private citizens to a closed meeting to discuss the future, including a sell-off of city assets.

    Philadelphia Mayor Michael Nutter, whose municipality has the lowest credit rating of the five most-populous U.S. cities, did just that.

    My translation: Philadelphia is bankrupt. However, that easily discernible fact will of course be denied until it officially happens.

    Please consider Philadelphia Holds Closed Meeting With Wall Street:

    Philadelphia Mayor Michael Nutter, whose municipality has the lowest credit rating of the five most-populous U.S. cities, will address investors at a conference financed by underwriters and closed to the public and the press.

    The invitation bills tomorrow’s meeting as a chance to hear “Philadelphia leaders and investors discuss building the city’s future.”

    Philadelphia is hoping to attract investors for the city, which is rated three steps above junk by Standard & Poor’s. The city and its authorities have $8.75 billion in outstanding debt as of September, according to bond documents. Philadelphia’s pension system is 47.6 percent funded this year, the documents say.

    Tours of city assets are set for the second day of the conference, including the Philadelphia Gas Works, the largest municipally owned natural-gas utility in the U.S. The city plans to hire a broker to steer the sale of the system, which may fetch as much as $496 million, according to Lazard Ltd. (LAZ)

    Sam Katz, chairman of the Pennsylvania Intergovernmental Cooperation Authority, created in a 1991 state law that oversees the city’s finances, said that with the conference being held locally, it “certainly created some concern on the part of people that it should be made public.”

    He’s more troubled, however, by the fact the school district isn’t on the agenda, he said. Facing a $304 million deficit, school officials have asked the city for $60 million and the state for $120 million.

    “The school district’s in a crisis,” Katz said. “They’re the same tax base.”

    Philadelphia officials facing a $1.35 billion spending gap over five years voted in March to shut 9 percent of its public schools.

    Philadelphia, 5th Largest City in US is Bankrupt


    It does not take a genius to figure out what is going on here. Philadelphia is bankrupt. Without even seeing the details, it is safe to assume untenable union wages and pension benefits are at the heart of it all. A 47.6% funded pension is rather telling in and of itself.

    Gutless Mayor Michael Nutter does not even have the decency to let the public or the press hear what is going on. Instead he invited Wall Street to a private tour of Philadelphia's assets, hoping to sell assets and stave off the inevitable.

    What fundamental issues is Nutter solving?

    Pensions? No
    Schools? No
    Union Salaries? No
    Bloated Payrolls? No
    Benefits? No

    Instead of inviting Wall Street to a private tour, Nutter ought to be inviting the press and private citizens to a press conference to declare the city's bankruptcy.

    We've been down this path before, most recently in Stockton, California. Here are some Stockton Bankruptcy Articles to consider in case you are not familiar with the story.

    Most relevant to Philadelphia is a ruling the Stockton Bankruptcy is Valid, City Acted in Good Faith. The judicial ruling means bondholders are at risk, and the city will not be forced to raise taxes to pay off creditors.

    Also see CalPERS Pension System in the Crosshairs of Stockton Bankruptcy Dispute.

    With those rulings, Philadelphia's cost of borrowing is likely to soar. Regardless, the city is nothing but a walking zombie now. The end is at hand.

  13. #93
    Creepy Ass Cracka & Site Owner Ryan Ruck's Avatar
    Join Date
    Jul 2005
    Location
    Cincinnati, OH
    Posts
    25,061
    Thanks
    52
    Thanked 78 Times in 76 Posts

    Default Re: Financial Crisis - 2013 - ????

    More on the farmland bubble...


    Land Boom

    May 16, 2013

    Farmland prices appear to be entering an economic bubble that could end in a rapid price decline as happened in the 1980s. A dozen agricultural economic experts discussed the possibility at the 2012 Breimyer Seminar sponsored by the College of Agriculture, Food and Natural Resources (CAFNR) and University Extension at the University of Missouri.

    Ron Plain
    , the D. Howard Doane Professor of Agricultural and Applied Economics at CAFNR, said land values have recently increased at a rate noticeably higher than the traditional norm. Such increases have occurred only twice in the 20th Century, each resulting in a price bubble and resulting crash. The first bubble occurred in the 1920s that later saw the value of farmland drop 65 percent. The second bubble occurred in the late 1970s and into the early 1980s. After that, farmland prices dropped 39 percent, triggering what was called the Midwest Farm Crisis.

    Missouri farmland
    prices are exceeding $4,000 per acre in some areas, an increase from $600 per acre in 1986. Plain said prices are rising because of inflation, low interest rates, farmers expanding their operations, productivity increases and declining farm acreage.

    The annual seminar brings together experts to discuss important issues facing agriculture. The seminars were started by Harold Breimyer in the 1970s. He taught agricultural economics at MU after a career at the USDA. Tough topics facing agriculture and bold and diverse solutions were his specialty. Seminars were named after him and his philosophy. After Breimyer died in 2001, an endowment was secured to continue the discussions. It attracts speakers from across the country to identify problems and pose solutions.

    Low Interest Rates and Strong Commodity Prices

    William Edwards, Iowa State University Extension Economist, quoted an Iowa Realtors Land Institute Survey that showed an increase of 10.8 percent in that state’s farmland prices in just six months – from Sept. 2011 to March 2012. His state was the first to see a $20,000 per acre sale price – up from the previous record of $16,750 per acre.

    Edwards said 74 percent of the state’s land purchasers were other farmers and 22 were investors. Just three percent were new farmers.

    Peter Klein, associate professor of applied social sciences at MU and the director of the McQuinn Center for Entrepreneurial Leadership, said historically low borrowing interest rates are helping fuel current purchases. While these rates are expected to continue in the short term, there are no guarantees that these will continue beyond next year. Federal Reserve Chairman Ben Bernanke estimated that low borrowing rates will continue through 2014. Interest rate uncertainly after that, and the prospects of inflation, is causing many buyers to pull the trigger now.


    Part of the attractiveness of land comes from increasing commodity prices of the last few years. Joe Horner, extension associate professor of agricultural economics at MU, said corn and soybean crops in Missouri have increased each of the last five years and are now approaching $4.5 billion in annual impact. Farmers are willing to pay more for land when commodity prices are high.

    Pat Westhoff, professor and director of the Food and Agricultural Policy Research Institute (FAPRI) within CAFNR, said global demand is supporting this optimism.


    Westhoff pointed to Asian economic growth and changing diets, and emerging bio energy markets. China is the number one importer of U.S. agricultural products. Global food demand could double by 2050.

    Such boosts in crop futures is triggering investors from outside of the farm sector to look at buying ground, said Chris Boessen, CAFNR teaching assistant professor in agricultural and applied economics.

    Institutional investors are wary of volatile gold and stocks, and are disappointed with the low return on bonds. Farmland, on the other hand, has yielded a solid 10.6 percent in sale price between 1970 and 2010, he said. This compares to stocks returning 10 percent, commercial real estate returning 8.7 percent and bonds yielding 8.2 percent, during the same period.

    Farmland, Boessen noted, also tends to historically increase in value with inflation, making it a safer investment.


    Time to Jump In? Not So Fast

    So is it time to buy early and heavy in farmland and get rich? Think twice said one economist.

    Using a cold and analytical spreadsheet, Ray Massey, extension professor in agricultural and applied economics, encourages potential investors to remember that all booms eventually end and the value of anything returns to its inherent intrinsic value. He said the decision to buy land now shouldn’t be influenced by the euphoria of present profits, but rather analyzing it as any business venture.

  14. #94
    Creepy Ass Cracka & Site Owner Ryan Ruck's Avatar
    Join Date
    Jul 2005
    Location
    Cincinnati, OH
    Posts
    25,061
    Thanks
    52
    Thanked 78 Times in 76 Posts

    Default Re: Financial Crisis - 2013 - ????


    Honoring Veterans As Monuments Decay, Funds Dry Up

    May 26, 2013

    On the shoreline of Hawaii's most famous beach, a decaying structure attracts little attention from wandering tourists.

    A few glance curiously at the crumbling Waikiki Natatorium, a salt water pool built in 1927 as a memorial to the 10,000 soldiers from Hawaii who served in World War I. But the monument's walls are caked with salt and rust, and passers-by are quickly diverted by the lure of sand and waves.

    The faded structure has been closed to the public for decades, the object of seemingly endless debate over whether it should be demolished or restored to its former glory. The latest plan is to replace it with a beach, more practical for the state's lucrative tourism industry — and millions of dollars cheaper, according to state and local officials. They say a full restoration could cost nearly $70 million.

    The corroding monument has challenged the community to maneuver a delicate question: How do we honor those who have served when memorials deteriorate and finances are tight?

    Similar debates have been playing out across the nation.

    The National Trust for Historic Preservation waged a 2½-year fight to restore the aging Tomb of the Unknowns in Arlington National Cemetery in Washington, D.C., when some people proposed replacing it. Far less disagreement surrounded a decision to update the War Memorial Opera House in San Francisco after a powerful earthquake in 1989.

    In Greensboro, N.C., residents have been grappling with what to do with the city's own decaying tribute to the soldiers of World War I.

    The Greensboro World War Memorial Stadium hosted minor league baseball for decades and even served as a location for notable sports films such as "Leatherheads" and "Bull Durham."

    Yet, despite continued use by kids and college-level athletes, the structure is falling into disrepair.

    The historic pebbled facade is falling off, and some of the bleachers are blocked off because of crumbling concrete, said David Wharton, a Greensboro resident who is fighting as a member of his neighborhood association to restore the structure.

    It's been a losing battle. The city rejected two referendums to fund renovations and chose to build a new stadium for minor league baseball instead of fixing up the old one.

    As a classics professor at University of North Carolina-Greensboro, Wharton has a soft spot for historic places. But he recognizes there are many other priorities competing for the millions of dollars it would take to restore the stadium.

    A city group is exploring different ways to use the space, and preservation advocates hope the monument can be saved even if that means changing the stadium's purpose.

    For many residents, the structure's architectural and historic significance pales in comparison to more immediate needs.

    "The war was a long time ago," Wharton said. "I don't think it's meaningful for most people."

    Sometimes, communities decide that memorials aren't worth the price.

    In Michigan's upper peninsula, the Wakefield Memorial Building once stood as a grand structure overlooking a lake in Wakefield, an old mining town. The memorial, built in 1924 to commemorate the sacrifices of World War I soldiers, was expansive, including a banquet hall, meeting room and theater.

    By the 1950s, the community couldn't afford the upkeep of the building and sold it to a private owner. Over the years, there were attempts to renovate the structure. But it was deemed too expensive and by 2010, the building was demolished.

    John Siira, the city manager, said there are plans to build a new memorial at the site, including a City Hall and library.

    But the project is on hold, and Siira said he's not sure when construction will start or when the project will pick up again.

    The lot where the building used to stand is now an empty lawn. The snow melted just last week, remnants of a long winter.

    In Honolulu, the fight over the beachside memorial is far from over.

    Jason Woll, who manages the beaches and parks in Waikiki, says the salty air, crashing waves and decades-old construction material have contributed to the memorial's demise.

    "Unfortunately this may have had its day in the sun," Woll said. "It's a World War I memorial but quite frankly, it looks like it's been through war."

    Hawaii state and local officials recently announced a proposal to tear down the building and have started analyzing the plan — a process expected to take at least a year.

    Honolulu Mayor Kirk Caldwell says the demolition has been a long time coming.

    "The greater disrespect is allowing the pool to continue to crumble and fall into the sea," Caldwell said.

    Caldwell says the new beach would better serve local residents and plans to preserve the memorial's arch will honor the soldiers. Demolishing the structure for $18 million is much cheaper than the $69 million price tag attached to full renovation, he said.

    But an organization called Friends of the Natatorium says the city's cost analysis is wrong and renovation would in fact be cheaper than demolition. The group, led by former state lawmaker Peter Apo, wants a moratorium on any plans to destroy the memorial to give the group time to fundraise for restoration.

    Apo says because the building is on the National Register of Historic Places, a restoration campaign could attract philanthropy from across the nation. But he acknowledges that it could be hard to garner public support. World War I doesn't carry the same significance in Hawaii as World War II, and many people like the idea of a new beach.

    The site is such a safety hazard that public access has been blocked since 1979 — well past the pool's days of hosting legendary athletes like Olympic swimmer and surf icon Duke Kahanamoku.

    Crabs scuttle between "Danger" signs lining the building's edges, and sharks swim in the pool, beneath the cracks of the crumbling floor.

    "We're a nation of short memory," Apo said.

  15. #95
    Creepy Ass Cracka & Site Owner Ryan Ruck's Avatar
    Join Date
    Jul 2005
    Location
    Cincinnati, OH
    Posts
    25,061
    Thanks
    52
    Thanked 78 Times in 76 Posts

    Default Re: Financial Crisis - 2013 - ????

    Coming soon to a neighborhood near you!


    Germany Sees "Revolution" If Welfare Model Scrapped

    May 28, 2013

    German Finance Minister Wolfgang Schaeuble warned on Tuesday that failure to win the battle against youth unemployment could tear Europe apart, while abandoning the continent's welfare model in favour of tougher U.S. standards would cause "revolution".

    Germany, along with France and Italy, backed urgent action to rescue a generation of young Europeans who fear they will not find jobs, with youth unemployment in the EU standing at nearly one in four, more than twice the adult rate.

    "We need to be more successful in our fight against youth unemployment, otherwise we will lose the battle for Europe's unity," Schaeuble said.

    While Germany insists on the importance of budget consolidation, Schaeuble spoke of the need to preserve Europe's welfare model.

    If U.S. welfare standards were introduced in Europe, "we would have revolution, not tomorrow, but on the very same day," Schaeuble told a conference in Paris.

    "We have to rescue an entire generation of young people who are scared. We have the best-educated generation and we are putting them on hold. This is not acceptable," Italian Labour minister Enrico Giovannini said.

    Germany in particular, weary of a backlash as many in crisis-hit European countries blame it for austerity, has over the past weeks taken steps to tackle unemployment, striking bilateral deals with Spain and Portugal.

    German ministers told the conference that, to help young people find jobs, Europe must continue on the path of structural reforms to boost its competitiveness as well as make good use of available EU funds, including 6 billion euros that leaders have set aside for youth employment for 2014-20.

    While all agreed on the urgency needed to tackle youth unemployment, ministers offered no concrete plans, insisting Europe must be pragmatic and work on various strands.

    Schaeuble said this was why Germany had also decided to strike deals with countries such as Spain and Greece.

    "Let's be honest, there is no quick fix, there is no grand plan," said Werner Hoyer, head the European Investment Bank.

    Together with ministers, he said policies aimed at boosting youth employment must focus on small and medium-sized enterprises as they are the main entry point to the labour market for most.

    More than half of Spain's under 25-year-olds are jobless, as are nearly 40 percent in Portugal. In Greece, youth unemployment shot to a record 64 percent in February.

    In March 2013, the lowest youth unemployment rates were in Germany and Austria, both below 8 percent, highlighting the wide disparities within the EU.

    The youth employment crisis will be a central theme of a June EU leaders' summit, and German Chancellor Angela Merkel has invited EU labour ministers to a youth unemployment conference in Berlin on July 3.

    Following up on an idea aired earlier this month, French President Francois Hollande urged the euro zone to work towards a joint economic government with its own budget which could take on specific projects including tackling youth unemployment.

  16. #96
    Expatriate American Patriot's Avatar
    Join Date
    Jul 2005
    Location
    A Banana Republic, Central America
    Posts
    48,612
    Thanks
    82
    Thanked 28 Times in 28 Posts

    Default Re: Financial Crisis - 2013 - ????

    I wish to hell Europe would go down in flames already.

    The quicker, the better, the faster Americans will start to see the light.

    Or perhaps not.
    Libertatem Prius!


    To view links or images in signatures your post count must be 15 or greater. You currently have 0 posts.


  17. #97
    Creepy Ass Cracka & Site Owner Ryan Ruck's Avatar
    Join Date
    Jul 2005
    Location
    Cincinnati, OH
    Posts
    25,061
    Thanks
    52
    Thanked 78 Times in 76 Posts

    Default Re: Financial Crisis - 2013 - ????


    40 'Frightening' Facts On The Fall Of The US Economy

    May 27, 2013

    Submitted by Michael Snyder of The Economic Collapse blog,

    40 Statistics About The Fall Of The U.S. Economy That Are Almost Too Crazy To Believe

    If you know someone that actually believes that the U.S. economy is in good shape, just show them the statistics in this article. When you step back and look at the long-term trends, it is undeniable what is happening to us. We are in the midst of a horrifying economic decline that is the result of decades of very bad decisions. 30 years ago, the U.S. national debt was about one trillion dollars. Today, it is almost 17 trillion dollars. 40 years ago, the total amount of debt in the United States was about 2 trillion dollars. Today, it is more than 56 trillion dollars. At the same time that we have been running up all of this debt, our economic infrastructure and our ability to produce wealth has been absolutely gutted. Since 2001, the United States has lost more than 56,000 manufacturing facilities and millions of good jobs have been shipped overseas. Our share of global GDP declined from 31.8 percent in 2001 to 21.6 percent in 2011. The percentage of Americans that are self-employed is at a record low, and the percentage of Americans that are dependent on the government is at a record high. The U.S. economy is a complete and total mess, and it is time that we faced the truth.

    The following are 40 statistics about the fall of the U.S. economy that are almost too crazy to believe...

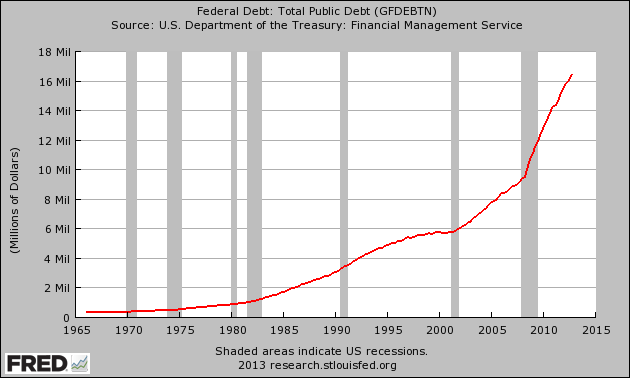
    #1 Back in 1980, the U.S. national debt was less than one trillion dollars. Today, it is rapidly approaching 17 trillion dollars...


    #2 During Obama's first term, the federal government accumulated more debt than it did under the first 42 U.S presidents combined.

    #3 The U.S. national debt is now more than 23 times larger than it was when Jimmy Carter became president.

    #4 If you started paying off just the new debt that the U.S. has accumulated during the Obama administration at the rate of one dollar per second, it would take more than 184,000 years to pay it off.

    #5 The federal government is stealing more than 100 million dollars from our children and our grandchildren every single hour of every single day.

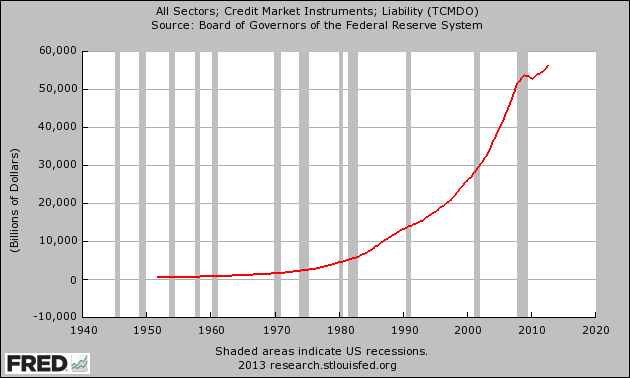
    #6 Back in 1970, the total amount of debt in the United States (government debt + business debt + consumer debt, etc.) was less than 2 trillion dollars. Today it is over 56 trillion dollars...


    #7 According to the World Bank, U.S. GDP accounted for 31.8 percent of all global economic activity in 2001. That number dropped to 21.6 percent in 2011.

    #8 The United States has fallen in the global economic competitiveness rankings compiled by the World Economic Forum for four years in a row.

    #9 According to The Economist, the United States was the best place in the world to be born into back in 1988. Today, the United States is only tied for 16th place.

    #10 Incredibly, more than 56,000 manufacturing facilities in the United States have been permanently shut down since 2001.

    #11 There are less Americans working in manufacturing today than there was in 1950 even though the population of the country has more than doubled since then.

    #12 According to the New York Times, there are now approximately 70,000 abandoned buildings in Detroit.

    #13 When NAFTA was pushed through Congress in 1993, the United States had a trade surplus with Mexico of 1.6 billion dollars. By 2010, we had a trade deficit with Mexico of 61.6 billion dollars.

    #14 Back in 1985, our trade deficit with China was approximately 6 million dollars (million with a little "m") for the entire year. In 2012, our trade deficit with China was 315 billion dollars. That was the largest trade deficit that one nation has had with another nation in the history of the world.

    #15 Overall, the United States has run a trade deficit of more than 8 trillion dollars with the rest of the world since 1975.

    #16 According to the Economic Policy Institute, the United States is losing half a million jobs to China every single year.

    #17 Back in 1950, more than 80 percent of all men in the United States had jobs. Today, less than 65 percent of all men in the United States have jobs.

    #18 At this point, an astounding 53 percent of all American workers make less than $30,000 a year.

    #19 Small business is rapidly dying in America. At this point, only about 7 percent of all non-farm workers in the United States are self-employed. That is an all-time record low.

    #20 Back in 1983, the bottom 95 percent of all income earners in the United States had 62 cents of debt for every dollar that they earned. By 2007, that figure had soared to $1.48.

    #21 In the United States today, the wealthiest one percent of all Americans have a greater net worth than the bottom 90 percent combined.

    #22 According to Forbes, the 400 wealthiest Americans have more wealth than the bottom 150 million Americans combined.

    #23 The six heirs of Wal-Mart founder Sam Walton have as much wealth as the bottom one-third of all Americans combined.

    #24 According to the U.S. Census Bureau, more than 146 million Americans are either "poor" or "low income".

    #25 According to the U.S. Census Bureau, 49 percent of all Americans live in a home that receives direct monetary benefits from the federal government. Back in 1983, less than a third of all Americans lived in a home that received direct monetary benefits from the federal government.

    #26 Overall, the federal government runs nearly 80 different "means-tested welfare programs", and at this point more than 100 million Americans are enrolled in at least one of them.

    #27 Back in 1965, only one out of every 50 Americans was on Medicaid. Today, one out of every 6 Americans is on Medicaid, and things are about to get a whole lot worse. It is being projected that Obamacare will add 16 million more Americans to the Medicaid rolls.

    #28 As I wrote recently, it is being projected that the number of Americans on Medicare will grow from 50.7 million in 2012 to 73.2 million in 2025.

    #29 At this point, Medicare is facing unfunded liabilities of more than 38 trillion dollars over the next 75 years. That comes to approximately $328,404 for every single household in the United States.

    #30 Right now, there are approximately 56 million Americans collecting Social Security benefits. By 2035, that number is projected to soar to an astounding 91 million.

    #31 Overall, the Social Security system is facing a 134 trillion dollar shortfall over the next 75 years.

    #32 Today, the number of Americans on Social Security Disability now exceeds the entire population of Greece, and the number of Americans on food stamps now exceeds the entire population of Spain.

    #33 According to a report recently issued by the Pew Research Center, on average Americans over the age of 65 have 47 times as much wealth as Americans under the age of 35.

    #34 U.S. families that have a head of household that is under the age of 30 have a poverty rate of 37 percent.

    #35 As I mentioned recently, the homeownership rate in America is now at its lowest level in nearly 18 years.

    #36 There are now 20.2 million Americans that spend more than half of their incomes on housing. That represents a 46 percent increase from 2001.

    #37 45 percent of all children are living in poverty in Miami, more than 50 percent of all children are living in poverty in Cleveland, and about 60 percent of all children are living in poverty in Detroit.

    #38 Today, more than a million public school students in the United States are homeless. This is the first time that has ever happened in our history.

    #39 When Barack Obama first entered the White House, about 32 million Americans were on food stamps. Now, more than 47 million Americans are on food stamps.

    #40 According to one calculation, the number of Americans on food stamps now exceeds the combined populations of "Alaska, Arkansas, Connecticut, Delaware, District of Columbia, Hawaii, Idaho, Iowa, Kansas, Maine, Mississippi, Montana, Nebraska, Nevada, New Hampshire, New Mexico, North Dakota, Oklahoma, Oregon, Rhode Island, South Dakota, Utah, Vermont, West Virginia, and Wyoming."

  18. #98
    Super Moderator and PHILanthropist Extraordinaire Phil Fiord's Avatar
    Join Date
    Dec 2005
    Posts
    3,496
    Thanks
    16
    Thanked 11 Times in 11 Posts

    Default Re: Financial Crisis - 2013 - ????

    But but but, the job rate is growing! sigh.

  19. #99
    Expatriate American Patriot's Avatar
    Join Date
    Jul 2005
    Location
    A Banana Republic, Central America
    Posts
    48,612
    Thanks
    82
    Thanked 28 Times in 28 Posts

    Default Re: Financial Crisis - 2013 - ????

    hahahahahahaha

    we're all brainwashed. You know that right?


    Do I take the red pill, or the blue pill?
    Libertatem Prius!


    To view links or images in signatures your post count must be 15 or greater. You currently have 0 posts.


  20. #100
    Super Moderator and PHILanthropist Extraordinaire Phil Fiord's Avatar
    Join Date
    Dec 2005
    Posts
    3,496
    Thanks
    16
    Thanked 11 Times in 11 Posts

    Default Re: Financial Crisis - 2013 - ????

    That is your choice, Rick. While I recommend the Red pill I cannot choose for you.

    Name:  tumblr_llu95jAZ2i1qj0h3wo1_500.png
Views: 22
Size:  48.4 KB

Thread Information

Users Browsing this Thread

There are currently 5 users browsing this thread. (0 members and 5 guests)

Similar Threads

  1. NFL 2012-2013 Season
    By Ryan Ruck in forum Sports
    Replies: 21
    Last Post: February 10th, 2013, 16:17
  2. Financial Crisis - 2010-2012
    By American Patriot in forum Financial
    Replies: 1116
    Last Post: December 31st, 2012, 14:25
  3. Flu Season: 2012-2013
    By American Patriot in forum News
    Replies: 0
    Last Post: December 10th, 2012, 15:15
  4. 2008 financial crisis result of terror attack?
    By catfish in forum Terrorism Around the World
    Replies: 8
    Last Post: March 10th, 2011, 06:32
  5. Financial Crisis - 2008-2010
    By vector7 in forum Financial
    Replies: 1810
    Last Post: October 19th, 2010, 16:28

Bookmarks

Posting Permissions

  • You may not post new threads
  • You may not post replies
  • You may not post attachments
  • You may not edit your posts
  •